How much will container lines ‘earn’? “Every time you hear ‘EBITDA,’ just substitute the phrase ‘bullshit earnings,'” said Charlie Munger of Berkshire Hathaway.
Different earnings metrics are highlighted by public shipping companies in different segments. Tanker and dry bulk owners are concerned with adjusted net income. Container shipping lines that are publicly traded frequently highlight adjusted earnings before interest, taxes, depreciation, and amortization.
EBITDA has been criticized for decades — Munger’s quote is from Berkshire Hathaway’s 2003 annual meeting — but due to accounting and industry-specific changes over the last four years, it has become an even more problematic metric for container shipping lines.
COVID boom follows IFRS 16
In January 2019, the International Financial Reporting Standards (IFRS) adopted Lease Accounting Rule 16 (IFRS 16).
Since then, vessel charters with terms longer than one year that are considered “right-of-use” assets have been accounted for in shipping lines’ income statements as depreciation and interest expenses, with depreciation taking precedence.
Prior to IFRS 16, carriers’ lease expenses were classified as operating costs. EBITDA includes operating costs but not depreciation.
The pandemic began a year after IFRS 16 was implemented. COVID altered consumer purchasing habits, causing freight rates to skyrocket. As a result, demand for chartered vessels increased, resulting in an unprecedented increase in lease rates and, ultimately, a dramatic increase in charter durations.
Increased Power of Nonoperating Owners (NOOs)
The companies that lease ships to liners, known as nonoperating owners (NOOs), wielded absolute power. Freight rates skyrocketed, and liner companies needed chartered ships to secure historically high freight income.
The Harpex index, which measures container-ship charter rates, was eight times higher in March 2022 than it was before COVID.
Liners faced historically high NOO leasing rates and longer charter terms, with ships locked in for up to five years.
As a result, shipping lines have even more lease payment expenses recorded on their income statements as depreciation and interest. And, because charter durations are longer, the accounting effect of higher leasing rates on EBITDA will last for years.
EBITDA for container shipping includes freight revenue but excludes charter payments to NOOs, leading to a skewed financial picture.
Not surprisingly, container liner EBITDA has risen dramatically.

EBITDA versus EBIT
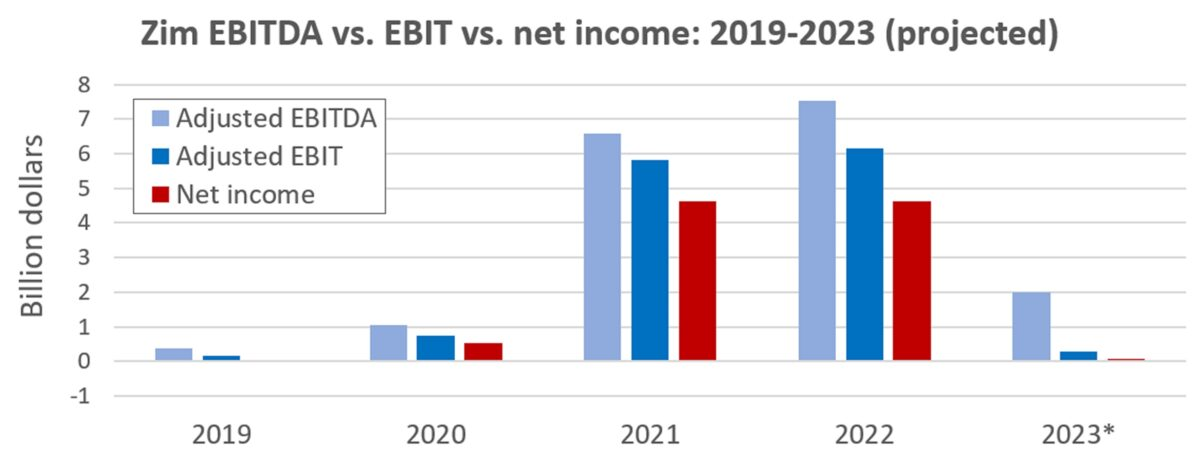
The most extreme example is Israeli carrier Zim (NYSE: ZIM). The majority of carriers own about half of their fleet and charter the rest. According to its annual report, filed on Tuesday, 14 March, Zim charters 94% of its fleet.
Not only have Zim’s leasing costs increased due to higher NOO rates, but the number of ships it charters has increased significantly, from 106 qualifying as right-of-use assets at the end of 2021 to 136 at the end of last year.
Another metric that shows the effect is earnings before interest and taxes, which accounts for the lease cost effect of long-term charters on depreciation (although not on interest).
Last year, Zim’s adjusted EBITDA exceeded its adjusted EBIT by $1.4 billion. Depreciation on the carrier increased by 81% in 2022 compared to 2021, “primarily due to an increase… related to right-of-use assets, primarily vessels.”
Zim expects adjusted EBITDA to be between $1.8 billion and $2.2 billion in 2023. In comparison, it anticipates an adjusted EBIT of $100 million to $500 million. The difference between these two ranges is $1.7 billion.
Other shipping lines exhibit the same divergence between EBITDA and EBIT, but to a lesser extent because they rely less on chartered ships than Zim.
Maersk’s adjusted EBITDA in 2022 was $36.8 billion, and its adjusted EBIT was $31.2 billion. According to Maersk’s annual report, depreciation of right-of-use assets increased by $1.1 billion year on year.
In 2022, Hapag-EBITDA Lloyd’s was $20.5 billion, and its EBIT was $18.5 billion.
According to Hapag-annual Lloyd’s report, depreciation and amortization increased by 16% in 2022 compared to 2021, “primarily due to a year-on-year increase in the percentage of vessels chartered in on a medium-term basis at concurrently higher charter rates.”
Net income is the real earnings.
Net income, which includes the bottom-line effects of interest and taxes, is the next level of accuracy for shipping line financial metrics after EBIT.
Taxes are generally not a major concern for most international shipping companies, though Zim is an exception.
“International shipping companies normally pay to the flag state in which their vessels are registered a fixed annual fee related to deadweight tonnage in lieu of income taxes,” shipping expert John McCown explained in his latest quarterly review of container shipping earnings.
“A notable exception is Zim, because the majority of its vessels fly the Israeli flag, which does not have a tonnage tax regime. As a result, Zim has a more typical income tax expense that varies with pretax income.”
Last year, Zim incurred $1.4 billion in income tax liabilities. As a result, there is a significant difference between net income and EBIT, and an even greater difference between net income and EBITDA.
Last year, Zim earned $4.6 billion in net income. Its adjusted EBIT was $1.5 billion greater. Its adjusted EBITDA exceeded its net income by $2.9 billion.
In the rear vs. in the front
In 2023, how much will container lines “earn”? It is determined by the metric.
EBITDA is sometimes referred to as earnings in press reports. The company’s most recent guidance led to a headline stating that it “expects to earn a cool two billion this year,” referring to the midpoint of its adjusted EBITDA guidance.
In comparison, the Bloomberg consensus on Thursday was for Zim to earn a net profit of $58.6 million. That’s still a significant improvement over its $13 million net loss in 2019, pre-COVID, but it’s much closer to the profit-loss line.
In the coming quarters, there will be a lot of attention paid to when falling freight rates push container lines into the red. When that happens, carriers will still report positive EBITDA.
According to Jefferies analyst Omar Nokta, Zim will earn a net profit of $89.9 million this year. He anticipates that net losses in the first half will be offset by profits in the second. Nokta expects full-year EBITDA to remain in the tens of billions of dollars, at $1.75 billion.
Even if large container lines begin to post net losses, they will not have lost the windfall they received during the COVID boom, nor will they face financial distress anytime soon.
Financial Stability of Major Lines
The top container lines earn have never been richer. Zim has amassed $4.6 billion in cash as a result of the boom ($3.9 billion when the dividend to be paid on April 4 is factored in). Hapag-Lloyd now has $17 billion in liquidity, up from $1.2 billion at the end of 2019. Maersk has a massive $28 billion in liquidity.
“No shipping company went bankrupt because it was unprofitable,” said Citi Global Head of Shipping Michael Parker in Lori Ann LaRocco’s “Dynasties of the Sea.” When they “run out of cash,” they declare bankruptcy.